Child Development
Alphas, Millennials, and Boomers: The Science of Population
Population pyramids allow us to picture the forces that shape generations.
Updated April 1, 2024 Reviewed by Lybi Ma
Key points
- Cohorts are groups of individuals born at the same time.
- Population pyramids describe the relative size of cohorts.
- The size of cohorts profoundly influences competition as we enter school, the workforce, or retirement.
We seem fascinated by generations, using them to evoke shared experiences and to push us apart.
Demography, the science of population change, defines a cohort as a group of people born at roughly the same time. They experience historical events together. The Greatest Generation came of age during the Great Depression and was profoundly shaped by World War II. Gen X was shaped by the profound changes in civil rights, by HIV and the LGBTQ+ movement, and by a cultural shift from free range to helicopter parenting. Generation Alpha are not just digital natives but never knew a time without cell phones and iPads.
Population Pyramids
Historical shifts and trends shape cohorts. Importantly, when we experience a historical event can influence us as much as that we experience it. Covid is a good example. The lockdown increased the number of newborns who spent a lot of time at home with their parents rather than in daycare. It created challenges in learning basic math and reading skills for first graders. It delayed job entry for many new graduates and profoundly changed the experience of those who found work as they entered remote workplaces or began as heavily stressed essential workers. Boomers retired earlier than planned. Same event. Different developmental impact.

Another profound influence on the experience of cohorts is the size of their generation relative to those older and younger. These differences are reflected in population pyramids. Cohort size is essential to understanding arguments about social security, education, or the number of young workers entering the economy.
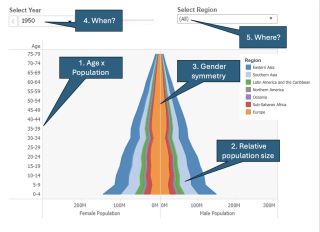
The population pyramid in Figure 1 is a snapshot of the world in 1950. The Y axis represents age. You can see why it is called a pyramid. Many more young people are at the base than older people at the top.
The graph is symmetrical around the vertical axis, with women on the left and men on the right. If you look carefully you can see the difference in the lifespans of men and women among the older cohorts and the WWII combat deaths among men in their 20s and 30s. Colors represent regions and the X-axis is relative population size.

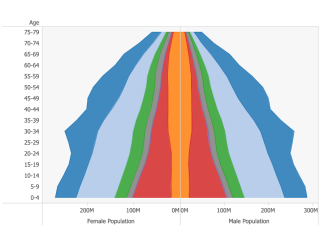
The world was very different in 2020 (Figure 2, left). The population has increased markedly. But the shape of the pyramid has also changed in important ways.
- Population growth has slowed among the younger cohorts—there is a decrease in world population between the Millennials and Gen Z, where the population pyramid pinches in.
- We often hear how Boomers were always the biggest generation and dominated the culture wherever we were (the very beginning of the Boomer generation is seen at the base of the 1950 pyramid). In 2020, that generation was dwarfed by the children of Boomers (that 'Boomlet' of 30- to 40-year-olds in the 2020 pyramid).
- Look also at the changing distribution of where people live. Europe (orange) has experienced a marked relative population decline as their birth rate waned. At the same time, the incredible improvement in infant mortality rates in sub-Saharan Africa has resulted in a relative increase in their representation in the world population.
Shapes and Fates
The challenges of younger people entering the workplace, political debates about Social Security, and arguments about the resources allocated for schools are all reflected in demographic shifts in our aging population.

The population pyramid on the left in Figure 3 shows North America in 1960. This is the end of the birth of the Boomers. We were a much larger cohort than our parents. Schools were a priority, many of us grew up in crowded classrooms of 30-40 students with temporary classrooms dotting the areas around older buildings.
You can see the 'nipped waist' of the generation before us, relatively few children were born during the Great Depression or World War II. There were also relatively few older adults. This is a time in the United States when John Kennedy started lobbying for Medicare and it was ultimately passed under Lyndon Johnson in 1965. Note the importance of timing. There were few adults older than 65 relative to the large number of workers supporting them.
The dependency ratio was high, however. You can think of people younger than 20 or older than 65 as economically dependent on people of working age. In 1960, there were many young, dependent children (although few were college-age and even fewer in college). There were relatively few older adults dependent on Medicare. Healthcare was also relatively inexpensive.
The dependency ratio in 2020 (right) is markedly different. The Baby Boomers have grown up but remain the largest cohort. As Boomers enter retirement, their Social Security and Medicare benefits will be provided by younger, working cohorts. In 2020, these cohorts will be equal, not larger in size to those being supported—children and those who have retired.
The birth rate has declined, but the size of the younger cohort has not. Thus the dependency ratio has increased: workers are supporting large numbers of children and older adults.
Generational Competition
Cohorts are defined by the fact that they go through transitions together. That has positive and negative consequences. The parents of Boomers demanded strong schools, and got them. But classes were crowded and the cohort entered the workforce together at a time, perhaps predictably, of high unemployment and job competition.
The Millennials, the boomlet, graduated in the Great Recession and just as they were getting on their feet ran head-first into Covid.
Gen Z began college when schools were contracting and crying out for new students to replace the declining number of 18- to 21-year-olds. They enter the workforce at a time when Boomers are retiring, so there are relatively more job openings. Yet a housing stock geared for larger families and the larger incomes of older buyers means housing is unaffordable for many. A relatively small cohort and low income make it difficult for them to gain the attention of policymakers or businesses.
Each generation faces its own challenges.
Summary
Psychologists often focus on the historical changes different generations face: screen time, Covid isolation, parenting, and peer pressure. Population pyramids look at the big picture. Who is affected? How are we shaped just by when we were born and how many of us we are? It's another tool in our arsenal.


